Managing data pipelines with full lineage
User story
In many organizations data is ingested from various source systems and then transformed and consumed based on different technologies. While the technologies are specific to the organization, data processing usually is based on multiple transformation steps. Changing the output of a source or a transformation step is potentially impacting subsequent transformation steps. A data scientist changing the output schema of his analysis or a data integration expert altering the output of a transformation step use an impact analysis to investigate whether the planned change is affecting other transformation steps or data users. The challenge is to identify how the data is used and if it is being used, who is the responsible person owning this part.
Overlooking a dependent transformation step or a data usage can cause subsequent data processing to fail with a consequence of having inconsistent or wrong data in other systems or in dashboards used for decision making.
As part of data governance also lineage information is collected in Aurelius Atlas. That is, capturing the data processing and the data usage as processes, where each process may consume data and may produce data. Looking at the lineage graph directly shows the consumers of data, which allows to relate it to the responsible persons.
To illustrate the process of finding relevant information from a lineage graph and who is responsible, the following scenario is described: An implementer of data pipeline wants to extend the schema of a particular table. To make sure that the subsequent processing will not fail, he wants to know who is using the data such that the subsequent processing is also adjusted.
Step by step guide
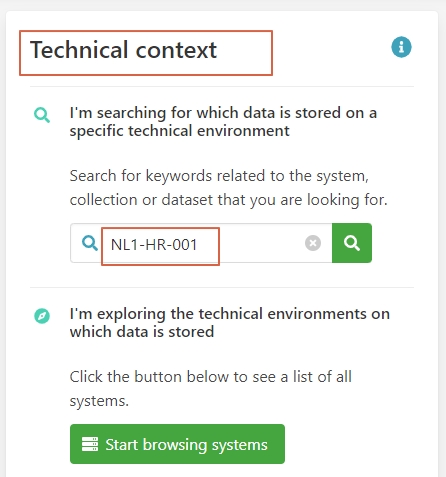
You can search for the table NL1-HR-001 in the technical context
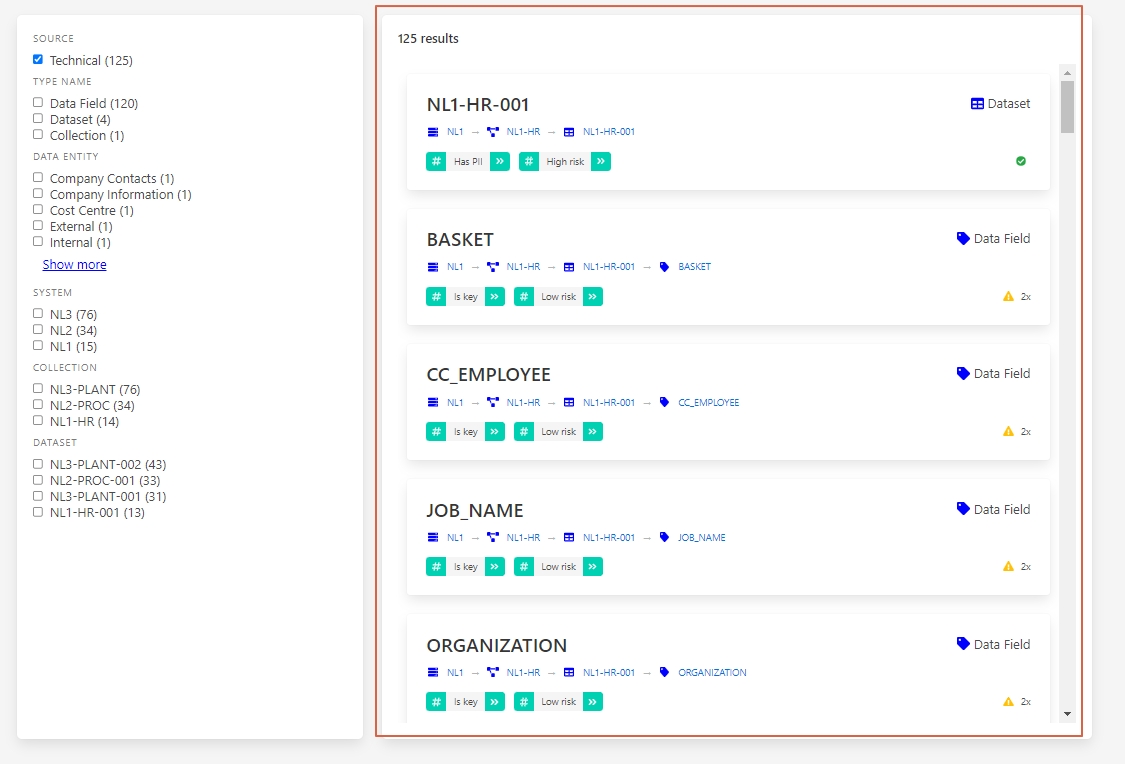
You get a list of results, lets click on the entity called NL1-HR-001
You are now on the details page of the dataset NL1-HR-001. Here you can see the following elements:
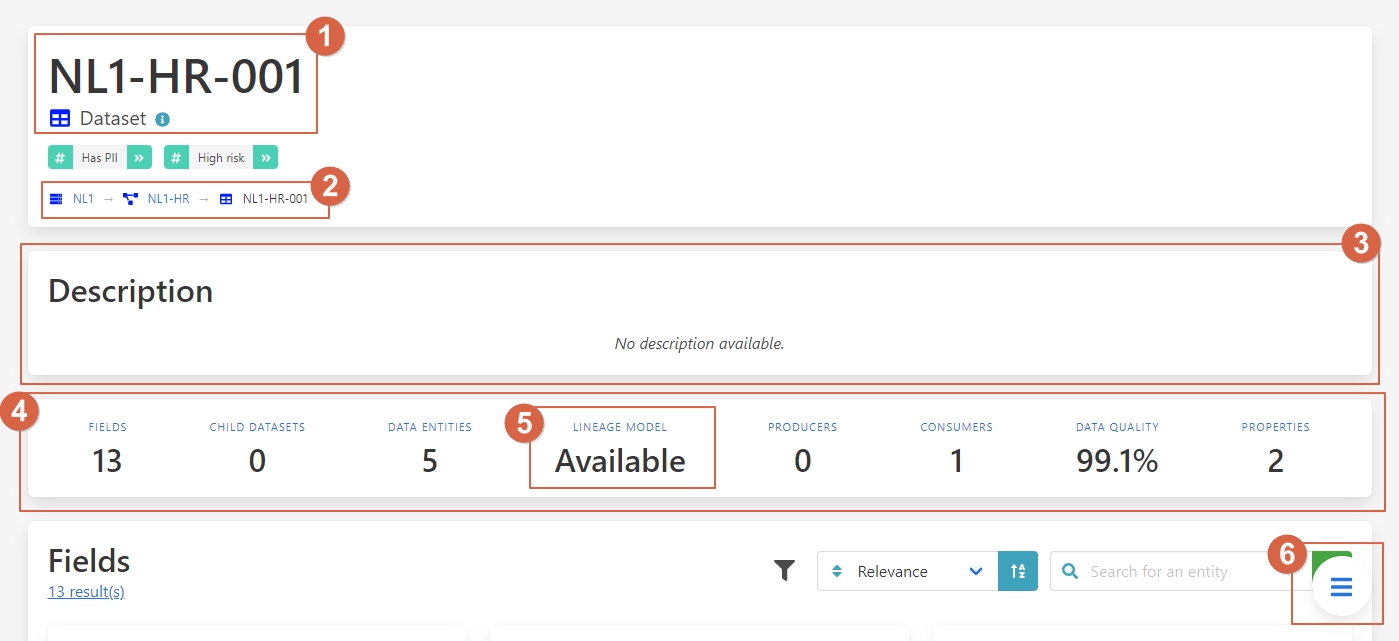
1. – Name and type of the entity.
2. – Breadcrumb: Showing the hierarchy of the entity.
3. – Description of the entity.
4. – Summary of all the elements of the page.
5. - If the lineage model is available or not.
6. - Button to navigate through each section quickly.
Navigate to the Lineage model:
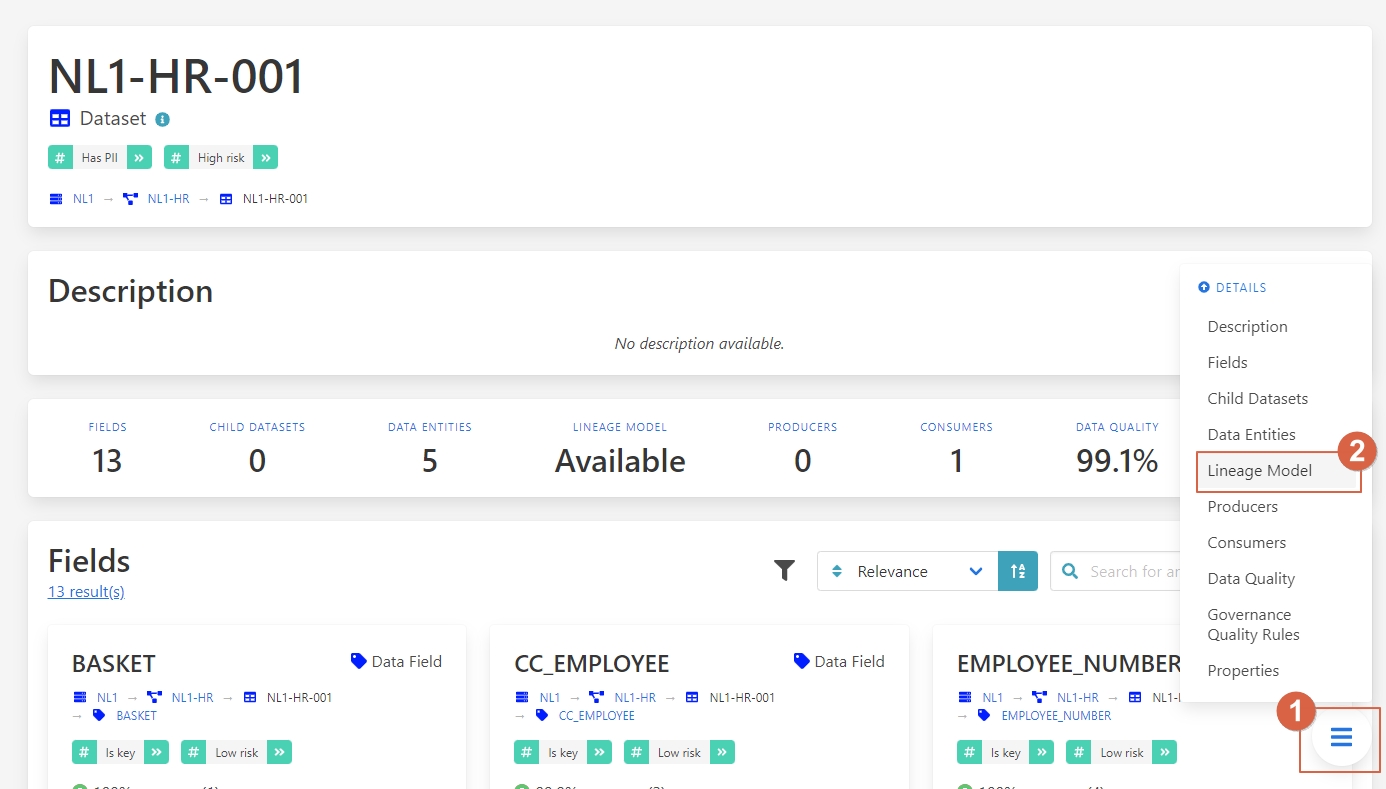
1. – Click on the button.
2 – Click on Lineage Model
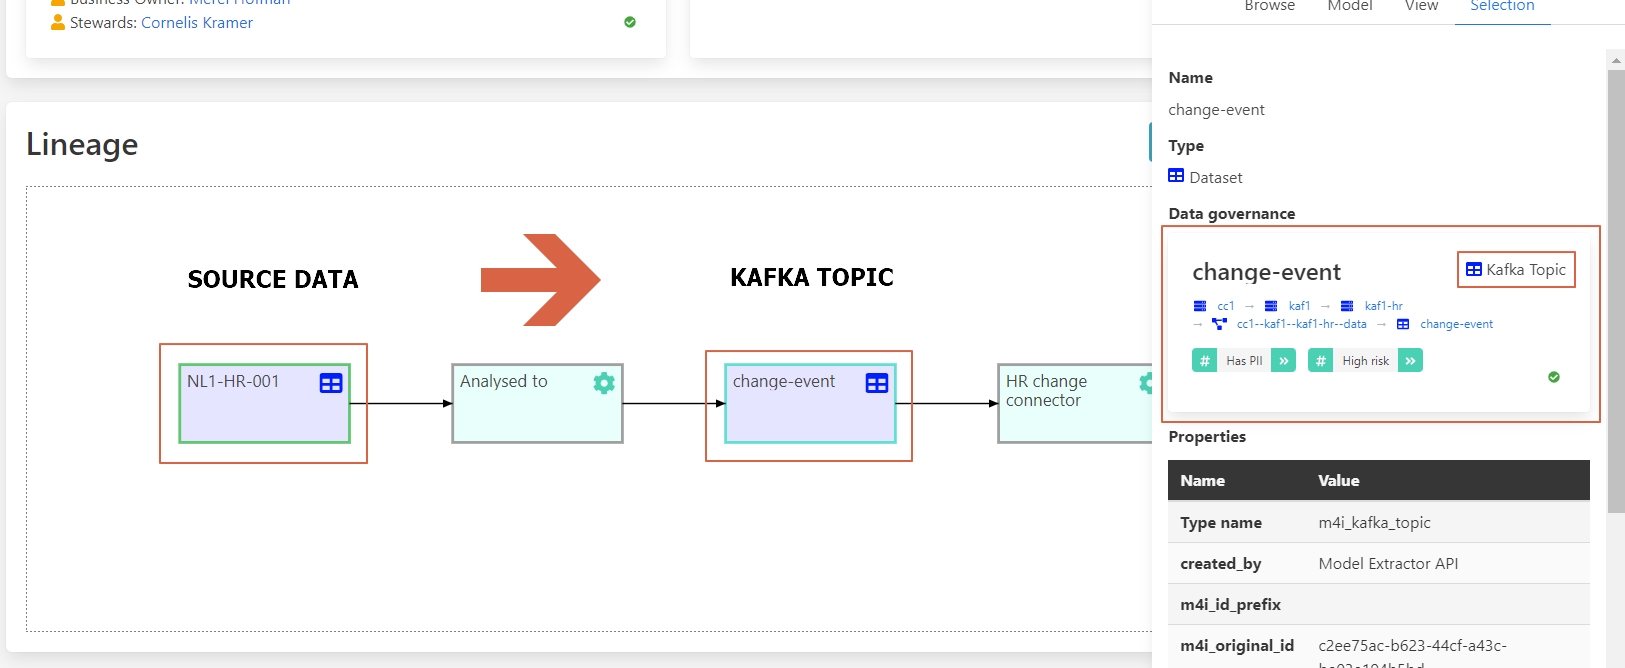
The lineage model shows the position of the entity in the data flow. It also clarifies where the data comes from and where the data flows to. In this case we see that the entity NL1-HR-001 is a source dataset that is used and processed in the organization.
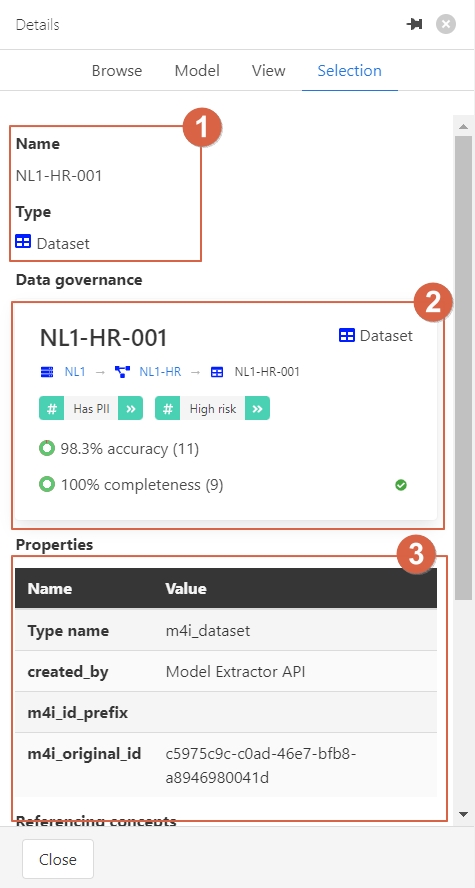
To get the details of each entity in the lineage model, click on the icon of the image to open the detail panel on the right hand side.
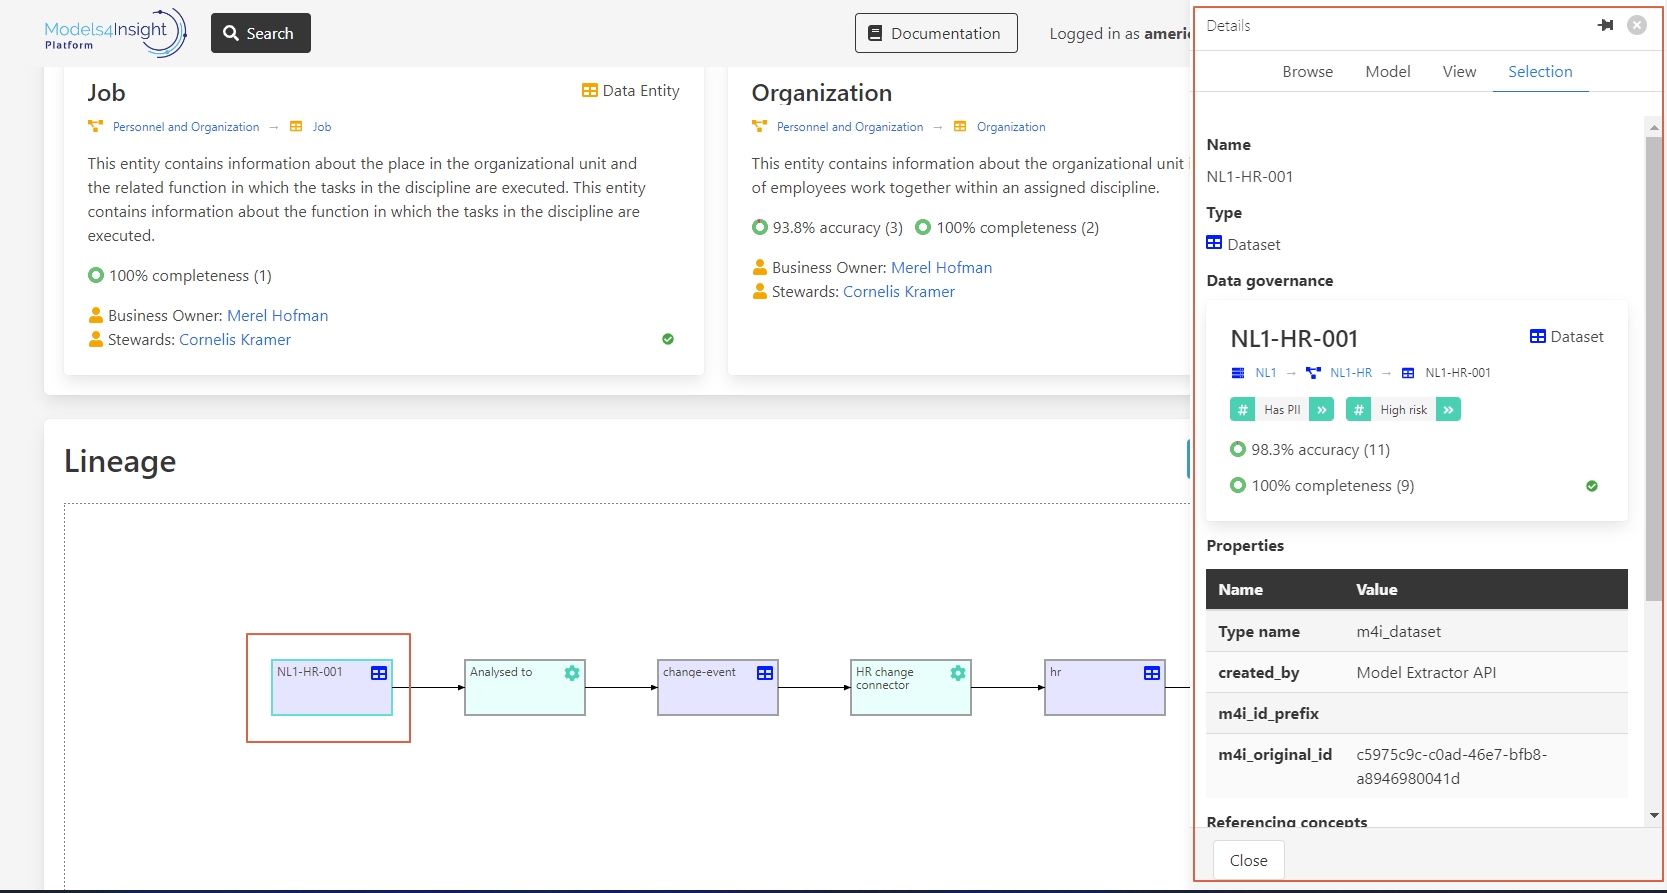
In this detail panel you can find all the information about the data, and how it’s being used.
Here is an overview of the elements on the detail page:
1– Name and type of data.
2– Data governance.
3– Properties of the data.
Let’s follow the flow of the data, if you click on the next entity called Change-event, you can see how the data is changed to a Kafka topic.
If you click on the next entity, you can see that this Kafka topic was converted into an Elastic index.
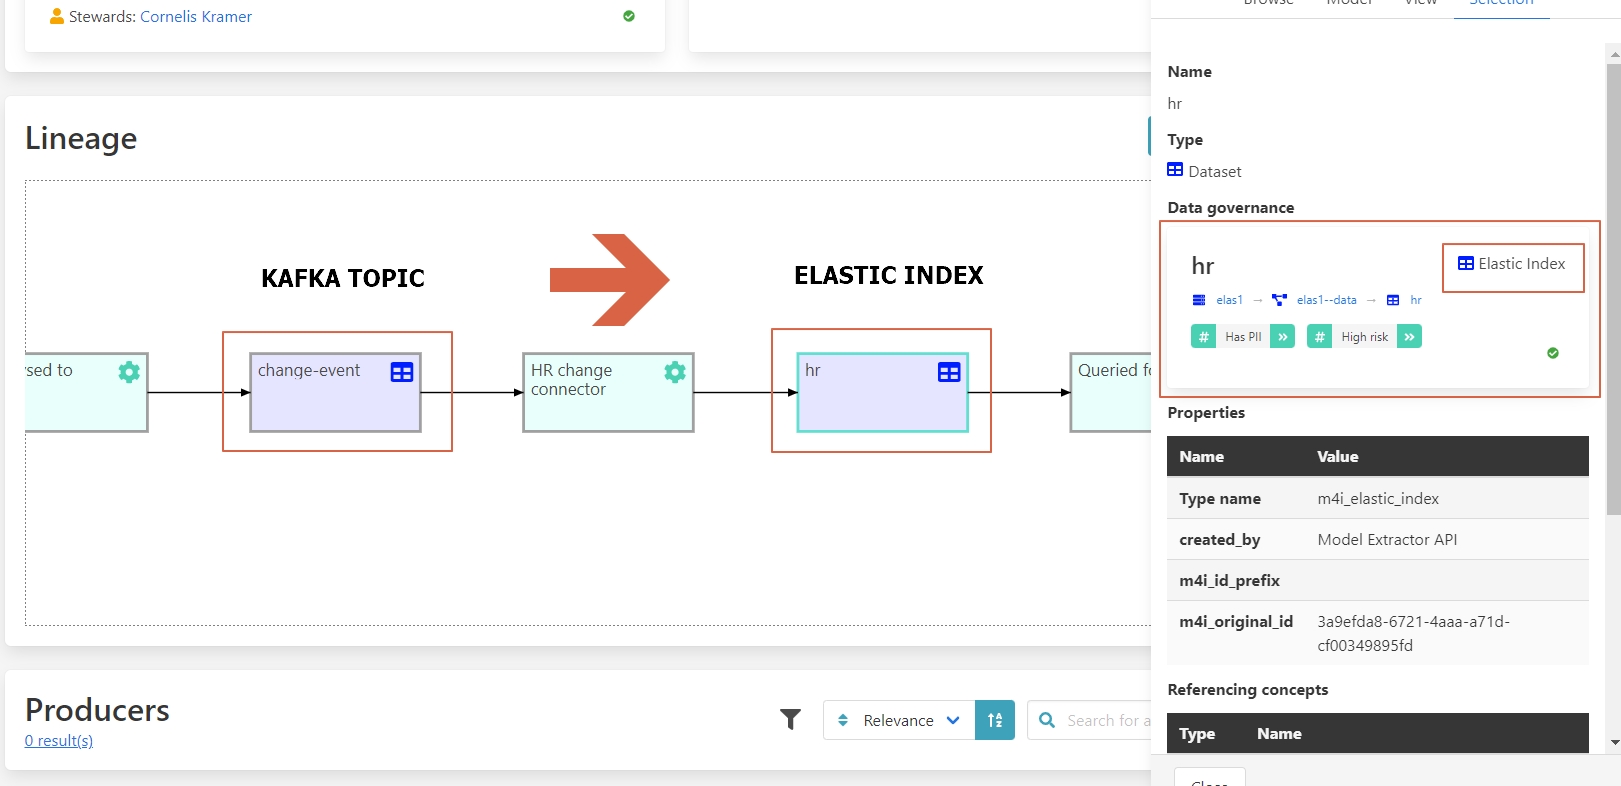
With the lineage graph you are able to see where the data is going and where it comes from. This is not limited to a particular system but it is across different applications and environments in which we are tracking the governance information. Following these steps, the implementer can learn where the data is being used and what subsequent processing can be effected by extending the schema.
Benefits
1 – Clear information about where the data is stored.
2 – See the entire data flow step by step.
3 – How this data is being used.
4 - Track sensitive information.
5 – Improve data compliance.